# pyecharts 的使用
pyecharts 官网 (opens new window) pyecharts 的画廊 (opens new window)
pip install pyecharts
# 折线图
# 导包,导入Line功能构建折线图对象
from pyecharts.charts import Line
from pyecharts.options import LabelOpts

# 得到折线图对象
line = Line()
# 添加x轴数据
1ine.add_xaxis(["中国", "美国", "英国"], label_opts=LabelOpts(is_show=False))
# 添加y轴数据
line.add_yaxis("GDp", [30, 20, 10])
# 生成图表
# render 会生成本地 HTML 文件,默认会在当前目录生成 render.html 文件
# 也可以传入路径参数,如 bar.render("mycharts.html")
1ine.render()
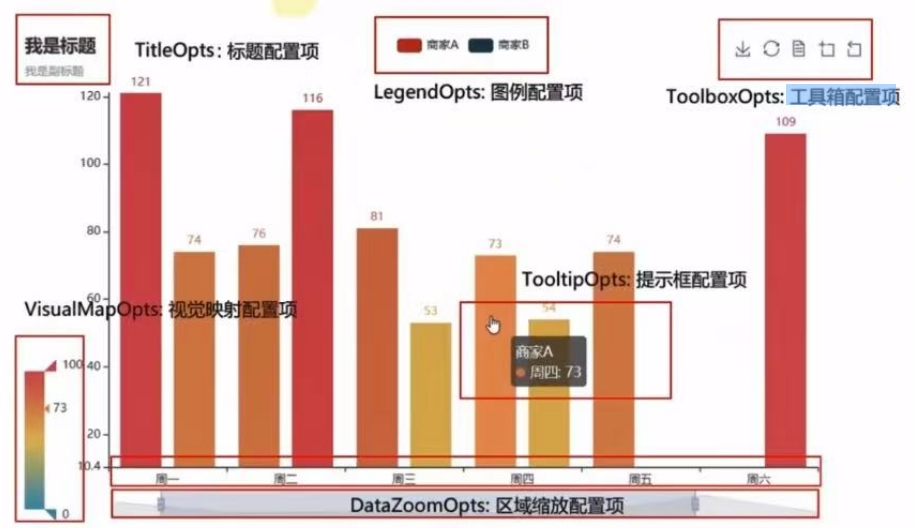
- 全局配置选项
from pyecharts.options import TitleOpts, LegendOpts, ToolboxOpts, VisualMapOpts, TooltipOpts

line.set_global_opts(
    # 标题配置项
	title_opts = TitleOpts(title = "测试", pos_left = "center", pos_bottom = "1%"),
	# 图例配置项
	legend_opts = LegendOpts(is_show = True),
	# 工具箱配置项
	toolbox_opts = ToolboxOpts(is_show = True)
	# 视觉映射配置项
	visualmap_opts = VisualMapOpts(is_show = True)
	# 提示框配置项
	tooltip_opts = TooltipOpts(is_show = True)
)
- 生成图片
# 导包
from pyecharts.render import make_snapshot
from snapshot_selenium import snapshot
# 生成图片
make_snapshot(snapshot, 1ine.render(), '00.png')
# 基础柱状图
from pyecharts.charts import Bar
from pyecharts.options import *

# 构建柱状图对象
bar = Bar()
# 添加x轴数据
bar.add_xaxis(["中国","美国","英国"])
# 添加y轴数据,并且不显示标签
bar.add_yaxis("GDP",[30,20,10], label_opts=LabelOpts(is_show=False))
# 反转x和y轴
bar.reversal_axis()
# 绘图
bar.render("基础柱状图.html")
- 添加时间线
from pyecharts.charts import Bar, Timeline
from pyecharts.options import *

bar1= Bar()
bar1.add_xaxis(["中围","美国","英国"])
bar1.add_yaxis("GDP",[30,20,10],label_opts=LabelOpts(position="right"))

bar2 = Bar()
bar2.add_xaxis(["中国","美国","英国"])
bar2.add_yaxis("GDp",[50,30,20],label_opts=LabelOpts(position="right"))

# 创建时间对象
# timeline = Timeline()
timeline = Timeline({
	# 设置主题色
    "theme": ThemeType.LIGHT # 默认 LIGHT
})

# timeline对象添加bar柱状图
timeline.add(bar1,"2021年GDP")
timeline.add(bar2,"2022年GDP")

# 设置时间线自动播放
timeline.add_schema(
    play_interval=1000,    # 自动播放的时间问隔,单位毫秒
    is_timeline_show=True, # 是否任自动播放的时候,显示时间线
    is_auto_play=True,     # 是否自动播放
    is_loop_play=True      # 是否循环播放
)

# 通过时间线绘图
timeline.render("基础桂状图-时间线.html")
# 基础地图
from pyecharts.charts import Map
from pyecharts.options import VisualMapOpts

map = Map()
data = [
    ("北京市",99),
    ("台湾省",199),
    ("上海市",199),
    ("湖南省",299),
    ("安徽省",299),
    ("广州省",399),
    ("湖北省",599),
 ]
# maptype:具体参考 pyecharts.datasets.map_filenames.json
map.add("地图", data, "china")

# 设置全局配置
map.set_global_opts(
    visualmap_opts=VisualMapOpts(
        is_show=True,
        is_piecewise=True, # 允许手动校准范围
        pieces=[
            {"min": 1, "max": 9, "label": "1-9", "color": '#FF0000'},
            {"min": 10, "max": 99, "label": "10-99", "color": '#00FF00'},
            {"min": 100, "max": 999, "label": "100-999", "color": '#0000FF'}
        ]
    )
)
map.render()
# matplotlib 的使用
Matplotlib(matrix+plot+library的缩写)是一个Python 2D绘图库,与numpy、pandas共享数据科学三剑客的美誉,也是很多高级可视化库的基础
# plot函数语法及参数说明
# x: x轴数据
# y: y轴数据
# linewidth: 线条宽度
# linestyle: 指定折线的类型,可以是实线、虚线、点虚线、点点线等,默认文实线
# color: 线条颜色
# marker: 可以为折线图添加点,该参数是设置点的形状,还有很多样式,如圆形、三角形、正方形等;
# markersize: 标记点大小
# markerfacecolor: 标记点颜色
# markeredgecolor: 标记点边缘颜色
# markeredgewidth: 标记点边缘宽度
# markerfacecoloralt: 标记点填充颜色
# fillstyle: 标记点填充样式
# label: 图例标签
# alpha: 透明度
import matplotlib.pyplot as plt

x = [1, 2, 3, 4, 5, 6, 7, 8, 9, 10]
y = [11, 12, 13, 14, 15, 16, 17, 18, 19, 20]

plt.plot(x, y)
plt.plot(x, y, color='red', marker='o', linestyle='-', linewidth=2, markersize=12)

plt.show()
# 设置中文
import matplotlib.pyplot as plt

x = [1, 2, 3, 4, 5, 6, 7, 8, 9, 10]
y = [11, 12, 13, 14, 15, 16, 17, 18, 19, 20]

# 方法一:全局设置
plt.rcParams['font.sans-serif'] = ['SimHei']  # 中文字体
plt.rcParams['axes.unicode_minus'] = False  # 显示负号
plt.rcParams['font.size'] = 12  # 字体大小

plt.figure(figsize=(8, 6),dpi=80) # 设置画布大小和分辨率
plt.plot(x, y, color='red', marker='o', linestyle='-', linewidth=2, markersize=12)

# 方法二:局部设置
fontdict = {
    'family': 'SimHei',
    'size': 16,
    'color': 'blue'
}
plt.xlabel('x轴标签', fontdict=fontdict) # x轴标签
plt.ylabel('y轴标签', fontdict=fontdict) # y轴标签
plt.title('标题信息', fontdict=fontdict) # 标题
plt.grid(True) # 显示网格

plt.xticks(range(1, 11)) # 设置x轴刻度
plt.yticks(range(11, 21)) # 设置y轴刻度

plt.show()
# 同图多线,并保存为图片
import matplotlib.pyplot as plt

y1 = [1, 3, 4, 5, 6, 7, 8]
y2 = [12, 13, 14, 13, 15, 17, 18]
x = range(1, 8)

plt.rcParams['font.sans-serif'] = ['SimHei']  # 中文字体
plt.rcParams['axes.unicode_minus'] = False  # 显示负号
plt.rcParams['font.size'] = 12  # 字体大小

plt.figure(figsize=(8, 6),dpi=80) # 设置画布大小和分辨率
plt.plot(x, y1, color='red',label='张三') # 画折线图
plt.plot(x, y2, color='green',label='李四') # 画折线图

plt.xticks(range(1, 8)) # 设置x轴刻度
plt.yticks(range(1, 20)) # 设置y轴刻度

plt.grid(alpha=0.4, linestyle=':') # 设置网格
plt.legend() # 显示图例

# 先保存图片,再显示图片
plt.savefig('折线图.png') # 保存图片
plt.show()
# arcpy 的使用
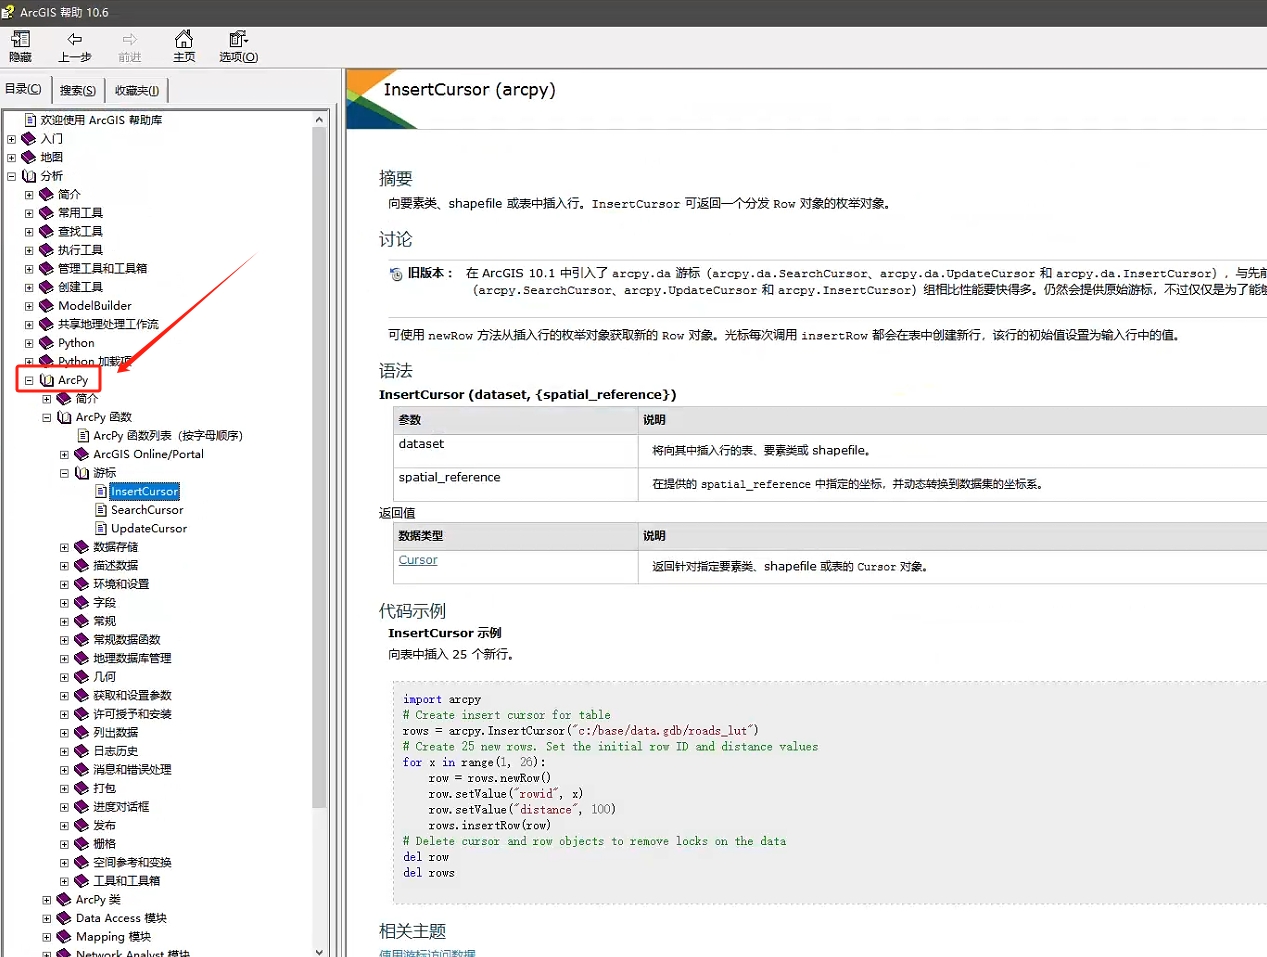
# ArcToolbox 四至范围计算
import arcpy
import logging

logging.basicConfig(filename='log.txt', level=logging.INFO, format='%(asctime)s - %(levelname)s - %(message)s')

input_feature_class = arcpy.GetParameterAsText(0)
logging.info(input_feature_class)

field_name_1 = 'xmin'
field_name_2 = 'xmax'
field_name_3 = 'ymin'
field_name_4 = 'ymax'

try:
    if not any(field.name == field_name_1 for field in arcpy.ListFields(input_feature_class)):
        arcpy.AddField_management(input_feature_class, field_name_1, 'TEXT', field_length = 280)

    if not any(field.name == field_name_2 for field in arcpy.ListFields(input_feature_class)):
        arcpy.AddField_management(input_feature_class, field_name_2, 'TEXT', field_length = 280)

    if not any(field.name == field_name_3 for field in arcpy.ListFields(input_feature_class)):
        arcpy.AddField_management(input_feature_class, field_name_3, 'TEXT', field_length = 280)

    if not any(field.name == field_name_4 for field in arcpy.ListFields(input_feature_class)):
        arcpy.AddField_management(input_feature_class, field_name_4, 'TEXT', field_length = 280)


    with arcpy.da.UpdateCursor(input_feature_class, ['SHAPE@',field_name_1,field_name_2,field_name_3,field_name_4]) as cursor:
        for row in cursor:
            geometry = row[0]
            extent = geometry.extent
            row[1] = extent.XMin
            row[2] = extent.XMax
            row[3] = extent.YMin
            row[4] = extent.YMax
            cursor.updateRow(row)

            logging.info(str(extent.XMin))

    arcpy.AddMessage("操作成功")

except Exception as e:
    logging.error("操作失败 {}".format(e))
    arcpy.AddError("操作失败 {}".format(e))
注意
不要加中文注释!!!
# 将84坐标系转为高德坐标系
# coding=utf-8
import arcpy
import math

def transformLat(x, y):
    ret = -100.0 + 2.0 * x + 3.0 * y + 0.2 * y * y + 0.1 * x * y + 0.2 * math.sqrt(abs(x))
    ret += (20.0 * math.sin(6.0 * x * math.pi) + 20.0 * math.sin(2.0 * x * math.pi)) * 2.0 / 3.0
    ret += (20.0 * math.sin(y * math.pi) + 40.0 * math.sin(y / 3.0 * math.pi)) * 2.0 / 3.0
    ret += (160.0 * math.sin(y / 12.0 * math.pi) + 320 * math.sin(y * math.pi / 30.0)) * 2.0 / 3.0
    return ret

def transformLon(x, y):
    ret = 300.0 + x + 2.0 * y + 0.1 * x * x + 0.1 * x * y + 0.1 * math.sqrt(abs(x))
    ret += (20.0 * math.sin(6.0 * x * math.pi) + 20.0 * math.sin(2.0 * x * math.pi)) * 2.0 / 3.0
    ret += (20.0 * math.sin(x * math.pi) + 40.0 * math.sin(x / 3.0 * math.pi)) * 2.0 / 3.0
    ret += (150.0 * math.sin(x / 12.0 * math.pi) + 300.0 * math.sin(x / 30.0 * math.pi)) * 2.0 / 3.0
    return ret

def delta(lat, lon):
    a = 6378245.0  # 克拉索夫斯基椭球参数长半轴a
    ee = 0.00669342162296594323 # 克拉索夫斯基椭球参数第一偏心率平方
    dLat = transformLat(lon - 105.0, lat - 35.0)
    dLon = transformLon(lon - 105.0, lat - 35.0)
    radLat = lat / 180.0 * math.pi
    magic = math.sin(radLat)
    magic = 1 - ee * magic * magic
    sqrtMagic = math.sqrt(magic)
    dLat = (dLat * 180.0) / ((a * (1 - ee)) / (magic * sqrtMagic) * math.pi)
    dLon = (dLon * 180.0) / (a / sqrtMagic * math.cos(radLat) * math.pi)
    mgLat = lat + dLat
    mgLon = lon + dLon
    return mgLat, mgLon

def wgs84_to_gcj02(lat, lon):
    if not (72.004 <= lon <= 137.8347 and 0.8293 <= lat <= 55.8271):
        return lat, lon
    dLat, dLon = delta(lat, lon)
    return dLat, dLon

def convert_shp_to_gcj02(input_shp, output_shp):
    reference = arcpy.SpatialReference(4490) #GCJ02和CGC2000的投影坐标系代码一样

    with arcpy.da.UpdateCursor(input_shp, ['Shape@','FID']) as cursor:
        for row in cursor:
            shape = row[0]
            new_points = []
            if shape.type == "point":
                lat = round(shape.firstPoint.Y, 20)
                lon = round(shape.firstPoint.X, 15)
                new_lat, new_lon = wgs84_to_gcj02(lat, lon)
                new_point = arcpy.Point(new_lon, new_lat)
                new_points.append(new_point)
            elif shape.type in ["polyline", "polygon"]:
                for part in shape:
                    part_points = []
                    for point in part:
                        if point:
                            lat = round(point.Y, 15)
                            lon = round(point.X, 15)
                            new_lat, new_lon = wgs84_to_gcj02(lat, lon)
                            new_point = arcpy.Point(new_lon, new_lat)
                            part_points.append(new_point)
                    new_points.append(part_points)

            if shape.type == "point":
                new_shape = arcpy.PointGeometry(new_points[0])
            elif shape.type == "polyline":
                new_shape = arcpy.Polyline(arcpy.Array(new_points))
            elif shape.type == "polygon":
                array = arcpy.Array(new_points)
				# 一定要添加正确的空间参考 reference
                new_shape = arcpy.Polygon(array,reference)
            row[0] = new_shape
            cursor.updateRow(row)

# 示例调用
input_shp = r"F:\DATA\菏泽\区县乡村\caoxian1\caoxian.shp"
convert_shp_to_gcj02(input_shp)
注意
arcpy.Polygon(array, reference) 一定要添加正确的空间参考 reference,否则会有 xy 容差
# 自动化办公
# pandas 和openpyxl 操作Excel比较
- 使用 pandas
# 适合处理大规模数据,尤其是数据分析和批量操作
# 如果需要快速读写 Excel 文件,优先选择 pandas
- 使用 openpyxl
# 适合需要对 Excel 文件进行精细操作(如设置样式、公式、图表等)
# 如果数据量较小,且需要更多控制权,可以使用 openpyxl
# 操作 Excel:pandas
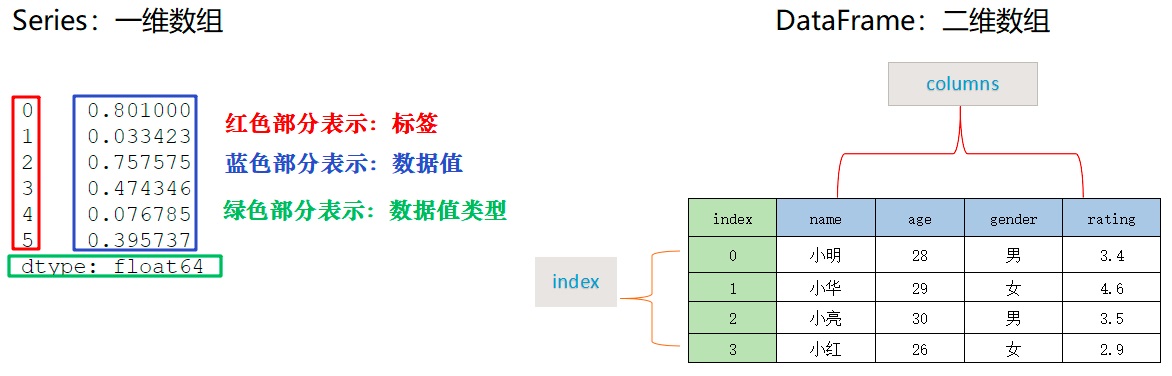
- Series 和 DataFrame 结构
- 创建 Excel
import pandas as pd

# 测试数据
data = {'ID': [1, 2, 3, 4],
        'Name': ['张三', '李四', '王五', '赵六'],
        'Age': [18, 20, 21, 19],
        'Grade': [90, 70, 80, 90]}

# 1.创建 DataFrame 对象
df = pd.DataFrame(data)

# 可选操作。
# 将 ID 设为索引,若不设置,会使用默认索引 narray(n),如下图所示
df = df.set_index('ID')

# 2.写入 excel 至指定位置(若文件已存在,则覆盖)
FILE_PATH = r'C:\Users\Administrator\Desktop\1.xlsx'
df.to_excel(FILE_PATH)
- 创建多个工作表的 Excel 文件
import pandas as pd

data1 = {'Name': ['Alice', 'Bob', 'Charlie'],
         'Age': [25, 30, 35]}
df1 = pd.DataFrame(data1)

data2 = {'Subject': ['Math', 'English', 'Science'],
         'Score': [80, 90, 85]}
df2 = pd.DataFrame(data2)

FILE_PATH = r'C:\Users\Administrator\Desktop\1.xlsx'
with pd.ExcelWriter(FILE_PATH) as writer:
    df1.to_excel(writer, sheet_name='Sheet1', index=False)
    df2.to_excel(writer, sheet_name='Sheet2', index=False)
    # index = False 表示不显示行索引
- 读取 Excel
# 读取 sheet,默认第一个
sheet = pd.read_excel(FILE_PATH)

# 读取指定 sheet,以下两种方式等同
sheet = pd.read_excel(FILE_PATH, sheet_name=1)
# sheet = pd.read_excel(FILE_PATH, sheet_name='Sheet2')

# 输出 sheet
print(sheet)
- 读取所有 Sheet
sheet = pd.read_excel(FILE_PATH, sheet_name=None)

# 输出多个 Sheet
for i in sheet.keys():
    print(i)
- 读取指定列
# 1.读取指定 列,以下两种方式等同
sheet = pd.read_excel(FILE_PATH, usecols=['Name', 'Age'])
# sheet = pd.read_excel(FILE_PATH, usecols=[0, 1])
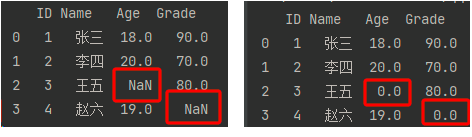
- 处理缺失值:pandas 默认将缺失值识别为:NaN(Not a Number)
sheet = pd.read_excel(FILE_PATH)

# 默认缺失值是 NaN:Not a Number
# fillna 将缺失值填充为 value
print(sheet.fillna(value=0))
- 指定数据类型
dtypes = {'Name': 'str', 'Age': 'int'}

# read_excel() 会自动判断数据类型,也支持手动指定
sheet = pd.read_excel(FILE_PATH, dtype=dtypes)
- 读取标题行
# 读取 sheet(默认第 1 行为标题,行索引为 0,即:header=0)
sheet = pd.read_excel(FILE_PATH)

# sheet 中第 2 行才是我们想要的标题(即:header=1)
sheet = pd.read_excel(FILE_PATH, header=1)

# sheet中没有标题,需要人为设定
sheet = pd.read_excel(FILE_PATH, header=None)
sheet.columns = ['ID', 'Name', 'Age', 'Grade']
sheet.set_index('ID', inplace=True)  # 指定索引列,并替换原数据
sheet.to_excel(FILE_PATH)  # 写入至 Excel
- 跳过 n 行读取
sheet = pd.read_excel(FILE_PATH, skiprows=2)
- 读取前、后 n 行数据
# 1.读取 excel
sheet = pd.read_excel(FILE_PATH)

# 读取前 3 行数据(默认 5 行)
print(sheet.head(3))

# 读取后 3 行数据(默认 5 行)
print(sheet.tail(3))
- 获取单元格
# 1.读取 sheet,不指定索引
sheet = pd.read_excel(FILE_PATH, index_col=None)

for i in sheet.index:
    # 读写单元格:ID列,i行 的数据
    print(f'第 i 行 = {i}, 其数据为 = {sheet["ID"].at[i]}')
- 筛选数据
def age_18_to_20(age):
    return 18 <= age <= 20

def grade_good(grade):
    return 90 <= grade <= 100

# 1.读取 excel 并指定 索引
sheet = pd.read_excel(FILE_PATH, index_col='ID')
sheet = sheet.loc[sheet['Age'].apply(age_18_to_20)].loc[sheet['Grade'].apply(grade_good)]
- 排序数据
# 1.读取 sheet 并指定 索引
sheet = pd.read_excel(FILE_PATH, index_col='ID')

# 功能:排序
# by:待排序的字段
# ascending:顺序(True) 还是 逆序(False)
# inplace:是否替换当前对象
# 方式1:排序单个字段
sheet.sort_values(by='Grade', ascending=False, inplace=True)
print(sheet)
#    Name  Grade
# ID
# 1    张三     90
# 4    赵六     90
# 3    王五     80
# 2    李四     70

# 方式2:排序多个字段,如:先顺序排列 Grade, 后逆序排列 ID
sheet.sort_values(by=['Grade', 'ID'], ascending=[True, False], inplace=True)
print(sheet)
#    Name  Grade
# ID
# 2    李四     70
# 3    王五     80
# 4    赵六     90
# 1    张三     90
- 遍历 excel
# 1.获取所有 sheet
df = pd.read_excel(FILE_PATH, sheet_name=None)

# 2.遍历 sheet 中的数据
for sheet_name, data in df.items():
    print(sheet_name, data)
# 操作 Excel:openpyxl
import openpyxl
from openpyxl.utils import get_column_letter, column_index_from_string

wb = openpyxl.load_workbook('01.xlsx')


print(wb.sheetnames) # 获取所有的sheet名称
for sheet in wb:
    print(sheet.title) # 获取所有的sheet名称

wb.create_sheet('mySheet') # 创建一个新的sheet
ws = wb.active # 获取当前的sheet
max_row = ws.max_row # 获取最大的行数
max_column = ws.max_column # 获取最大的列数
ws = wb['mySheet'] # 选择一个sheet
ws['A1'] = 'hello' # 写入一个值
ws.append([1, 2, 3]) # 写入一行

val = ws['A1'].value # 获取A1单元格的值
val.row # 获取A1单元格的行号
val.column # 获取A1单元格的列号
val.coordinate # 获取A1单元格的坐标
val.offset(1, 1) # 获取A1单元格的右下角的单元格

ws.cell(row=1, column=1) # 获取A1单元格的值
ws.cell(row=1, column=1).value # 获取A1单元格的值
ws.cell(row=1, column=1, value='hello') # 设置A1单元格的值

wc = ws['A1':'C3'] # 获取A1到C3的单元格
col = ws['A'] # 获取A列的单元格
row = ws[1] # 获取1行的单元格

get_column_letter(10) # 获取列号对应的字母
column_index_from_string('AAB') # 获取字母对应的列号
# 操作 Word:python-docx
- 空白文档
import docx
from docx import document

# 1.新建 文档对象
doc = docx.Document()
# [可选] 代码提示。需增加下列代码
# print(type(doc))
assert isinstance(doc, document.Document)  # 格式:doc, doc 的类型

# 2.保存文档,绝对路径 和 相对路径 均可
# doc.save(r'C:\Users\Administrator\Desktop\test.docx')
doc.save('test.docx')
- 标题
import docx
from docx import document

# 1.新建 文档对象
doc = docx.Document()
# [可选] 代码提示。需增加下列代码
# print(type(doc))
assert isinstance(doc, document.Document)  # 格式:doc, doc 的类型

# 2.添加 标题
# 标题
doc.add_heading(text='Python 操作 Word 教程', level=0)

# 章节标题(Level = 0~9)
doc.add_heading(text='第一章:Python 基础', level=1)
doc.add_heading(text='1.1 Python 基础语法', level=2)

# 3.保存文档
doc.save('test.docx')
- 段落
import docx
from docx import document

# 1.新建 文档对象
doc = docx.Document()
# [可选] 代码提示。需增加下列代码
# print(type(doc))
assert isinstance(doc, document.Document)  # 格式:doc, doc 的类型

# 2.添加 文本段落
paragraph = doc.add_paragraph('这是第一个文本段落')
paragraph.insert_paragraph_before("在之前,添加段落")
doc.add_paragraph(text='这是第二个文本段落', style='List Bullet')

# 3.保存文档
doc.save('test.docx')
- 文本
import docx
from docx import document

# 1.新建 文档对象
doc = docx.Document()
# [可选] 代码提示。需增加下列代码
# print(type(doc))
assert isinstance(doc, document.Document)  # 格式:doc, doc 的类型

# 2.添加 文本(同 文本段落)
paragraph = doc.add_paragraph()
run = paragraph.add_run('这是一个文本')

# 3.保存文档
doc.save('test.docx')
- 字体
import docx
from docx import document
from docx.shared import Pt
from docx.shared import RGBColor

# 1.新建 文档对象
doc = docx.Document()
# [可选] 代码提示。需增加下列代码
# print(type(doc))
assert isinstance(doc, document.Document)  # 格式:doc, doc 的类型

# 2.添加 文本(同 文本段落)
paragraph = doc.add_paragraph()
run = paragraph.add_run('这是一个文本')

# 3.设置字体
font = run.font
font.name = '微软雅黑'  # 字体名称
font.size = Pt(12)  # 字体大小
font.color.rgb = RGBColor(255, 0, 0)  # 红色
font.bold = True  # 加粗

# 4.保存文档
doc.save('test.docx')
- 图片
import docx
from docx import document
from docx.shared import Cm

# 1.新建 文档对象
doc = docx.Document()
# [可选] 代码提示。需增加下列代码
# print(type(doc))
assert isinstance(doc, document.Document)  # 格式:doc, doc 的类型

# 2.添加 图片,CM:厘米
doc.add_picture('1.png', width=Cm(10), height=Cm(5))

doc.save('test.docx')
- 表格
import docx
from docx import document

# 1.新建 文档对象
doc = docx.Document()
# [可选] 代码提示。需增加下列代码
# print(type(doc))
assert isinstance(doc, document.Document)  # 格式:doc, doc 的类型

# 2.添加 表格
table = doc.add_table(rows=2, cols=3)

# 获取第一行第二列的单元格,并修改内容
cell = table.cell(0, 0)
cell.text = '我是 A1'

# 输出单元格数据
for row in table.rows:
    for cell in row.cells:
        print(cell.text)

# 3.保存文档
doc.save('test.docx')
- 修改文档
import docx
from docx import document

# 1.创建 文档对象
doc = docx.Document('test.docx')
assert isinstance(doc, document.Document)

# 2.修改 文档(其它同理)
doc.paragraphs[0].text = '修改第一个段落'

# 3.保存 文档
doc.save('test.docx')
- 读取文档
import docx
from docx import document

# 1.创建 文档对象
doc = docx.Document('test.docx')
assert isinstance(doc, document.Document)

# 2.读取 文档
# 段落的文本
for p in doc.paragraphs:
    print(p.text)

# 3.保存 文档
doc.save('test.docx')
# 操作PDF会用到两个库:PyPDF2 和 pdfplumber
pip install PyPDF2

# PyPDF2 可以更好的读取、写入、分割、合并PDF文件
# pdfplumber 可以更好的读取 PDF 文件中内容和提取 PDF 中的表格
- 批量拆分
import os
from PyPDF2 import PdfFileWriter, PdfFileReader

def split_pdf(filename, filepath, save_dirpath, step=5):
    """
    拆分PDF为多个小的PDF文件,
    @param filename:文件名
    @param filepath:文件路径
    @param save_dirpath:保存小的PDF的文件路径
    @param step: 每step间隔的页面生成一个文件,例如step=5,表示0-4页、5-9页...为一个文件
    @return:
    """
    if not os.path.exists(save_dirpath):
        os.mkdir(save_dirpath)
    pdf_reader = PdfFileReader(filepath)
    # 读取每一页的数据
    pages = pdf_reader.getNumPages()
    for page in range(0, pages, step):
        pdf_writer = PdfFileWriter()
        # 拆分pdf,每 step 页的拆分为一个文件
        for index in range(page, page+step):
            if index < pages:
                pdf_writer.addPage(pdf_reader.getPage(index))
        # 保存拆分后的小文件
        save_path = os.path.join(save_dirpath, filename+str(int(page/step)+1)+'.pdf')
        print(save_path)
        with open(save_path, "wb") as out:
            pdf_writer.write(out)

    print("文件已成功拆分,保存路径为:"+save_dirpath)

split_pdf(filename, filepath, save_dirpath, step=5)
- 批量合并
import os
from PyPDF2 import PdfFileReader, PdfFileWriter

def concat_pdf(filename, read_dirpath, save_filepath):
    """
    合并多个PDF文件
    @param filename:文件名
    @param read_dirpath:要合并的PDF目录
    @param save_filepath:合并后的PDF文件路径
    @return:
    """
    pdf_writer = PdfFileWriter()
    # 对文件名进行排序
    list_filename = os.listdir(read_dirpath)
    list_filename.sort(key=lambda x: int(x[:-4].replace(filename, "")))
    for filename in list_filename:
        print(filename)
        filepath = os.path.join(read_dirpath, filename)
        # 读取文件并获取文件的页数
        pdf_reader = PdfFileReader(filepath)
        pages = pdf_reader.getNumPages()
        # 逐页添加
        for page in range(pages):
            pdf_writer.addPage(pdf_reader.getPage(page))
    # 保存合并后的文件
    with open(save_filepath, "wb") as out:
        pdf_writer.write(out)
    print("文件已成功合并,保存路径为:"+save_filepath)

concat_pdf(filename, read_dirpath, save_filepath)
- 提取文字内容
import os
import pdfplumber

def extract_text_info(filepath):
    """
    提取PDF中的文字
    @param filepath:文件路径
    @return:
    """
    with pdfplumber.open(filepath) as pdf:
        # 获取第2页数据
        page = pdf.pages[1]
        print(page.extract_text())

# 提取文字内容
extract_text_info(filepath)

# 如果想要提取所有页的文字,只需要改成:
with pdfplumber.open(filepath) as pdf:
 # 获取全部数据
 for page in pdf.pages
     print(page.extract_text())
- 提取表格内容
import os
import pandas as pd
import pdfplumber

def extract_table_info(filepath):
    """
    提取PDF中的图表数据
    @param filepath:
    @return:
    """
    with pdfplumber.open(filepath) as pdf:
        # 获取第18页数据
        page = pdf.pages[17]
        # 如果一页有一个表格,设置表格的第一行为表头,其余为数据
        table_info = page.extract_table()
        df_table = pd.DataFrame(table_info[1:], columns=table_info[0])
        df_table.to_csv('dmeo.csv', index=False, encoding='gbk')

# 提取表格内容
extract_table_info(filepath)

# 如果一页有多个表格,对应的数据是一个三维数组
tables_info = page.extract_tables()
for index in range(len(tables_info)):
    # 设置表格的第一行为表头,其余为数据
    df_table = pd.DataFrame(tables_info[index][1:], columns=tables_info[index][0])
    print(df_table)
    # df_table.to_csv('dmeo.csv', index=False, encoding='gbk')
- 提取图片内容
import os
import re
import fitz

def extract_pic_info(filepath, pic_dirpath):
    """
    提取PDF中的图片
    @param filepath:pdf文件路径
    @param pic_dirpath:要保存的图片目录路径
    @return:
    """
    if not os.path.exists(pic_dirpath):
        os.makedirs(pic_dirpath)
    # 使用正则表达式来查找图片
    check_XObject = r"/Type(?= */XObject)"
    check_Image = r"/Subtype(?= */Image)"
    img_count = 0

    """1. 打开pdf,打印相关信息"""
    pdf_info = fitz.open(filepath)
    # 1.16.8版本用法 xref_len = doc._getXrefLength()
    # 最新版本
    xref_len = pdf_info.xref_length()
    # 打印PDF的信息
    print("文件名:{}, 页数: {}, 对象: {}".format(filepath, len(pdf_info), xref_len-1))

    """2. 遍历PDF中的对象,遇到是图像才进行下一步,不然就continue"""
    for index in range(1, xref_len):
        # 1.16.8版本用法 text = doc._getXrefString(index)
        # 最新版本
        text = pdf_info.xref_object(index)

        is_XObject = re.search(check_XObject, text)
        is_Image = re.search(check_Image, text)
        # 如果不是对象也不是图片,则不操作
        if is_XObject or is_Image:
            img_count += 1
            # 根据索引生成图像
            pix = fitz.Pixmap(pdf_info, index)
            pic_filepath = os.path.join(pic_dirpath, 'img_' + str(img_count) + '.png')
            """pix.size 可反映像素多少,简单的色素块该值较低,可通过设置阈值过滤
			   以阈值10000为例过滤
			"""
            # if pix.size < 10000:
            #     continue

            """三、 将图像存为png格式"""
            if pix.n >= 5:
                # 先转换CMYK
                pix = fitz.Pixmap(fitz.csRGB, pix)
            # 存为PNG
            pix.writePNG(pic_filepath)

# 提取图片内容
extract_pic_info(filepath, pic_dirpath)
- 转换为图片
pip install pdf2image

# 对于 windows 用户需要安装 poppler for Windows
# 安装链接是:http://blog.alivate.com.au/poppler-windows/
# 还需要添加环境变量,将 bin 文件夹的路径添加到环境变量 PATH 中
import os
from pdf2image import convert_from_path, convert_from_bytes

def convert_to_pic(filepath, pic_dirpath):
    """
    每一页的PDF转换成图片
    @param filepath:pdf文件路径
    @param pic_dirpath:图片目录路径
    @return:
    """
    print(filepath)
    if not os.path.exists(pic_dirpath):
        os.makedirs(pic_dirpath)

    images = convert_from_bytes(open(filepath, 'rb').read())
    # images = convert_from_path(filepath, dpi=200)
    for image in images:
        # 保存图片
        pic_filepath = os.path.join(pic_dirpath, 'img_'+str(images.index(image))+'.png')
        image.save(pic_filepath, 'PNG')

# PDF转换为图片
convert_to_pic(filepath, pic_dirpath)
- 添加水印
from PyPDF2 import PdfFileReader, PdfFileWriter
from copy import copy

pdf = PdfFileReader('水印.pdf')
watermark = pdf.getPage(0)

r_pdf = PdfFileReader('input.pdf')
w_pdf = PdfFileWriter()

for page in range(r_pdf.getNumPages()):
    # 要添加水印的页面
    all_pdf = r_pdf.getPage(page)

    new_pdf = copy(watermark)
    # 合成水印,新页面添加水印,水印在文字下面
    new_pdf.mergePage(all_pdf)
    w_pdf.addPage(new_pdf)

with open('output.pdf', 'wb') as f:
    w_pdf.write(f)
- 在对 PDF 文件加密需要使用 encrypt 函数
import os
from PyPDF2 import PdfFileReader, PdfFileWriter

def encrypt_pdf(filepath, save_filepath, passwd='xiaoyi'):
    """
    PDF文档加密
    @param filepath:PDF文件路径
    @param save_filepath:加密后的文件保存路径
    @param passwd:密码
    @return:
    """
    pdf_reader = PdfFileReader(filepath)
    pdf_writer = PdfFileWriter()

    for page_index in range(pdf_reader.getNumPages()):
        pdf_writer.addPage(pdf_reader.getPage(page_index))

    # 添加密码
    pdf_writer.encrypt(passwd)
    with open(save_filepath, "wb") as out:
        pdf_writer.write(out)

# 文档加密
encrypt_pdf(filepath, save_filepath, passwd='xiaoyi')
- 针对已经加密的 PDF 文件,也可以使用 decrypt 函数进行解密操作
def decrypt_pdf(filepath, save_filepath, passwd='xiaoyi'):
    """
    解密 PDF 文档并且保存为未加密的 PDF
    @param filepath:PDF文件路径
    @param save_filepath:解密后的文件保存路径
    @param passwd:密码
    @return:
    """
    pdf_reader = PdfFileReader(filepath)
    # PDF文档解密
    pdf_reader.decrypt('xiaoyi')

    pdf_writer = PdfFileWriter()
    for page_index in range(pdf_reader.getNumPages()):
        pdf_writer.addPage(pdf_reader.getPage(page_index))

    with open(save_filepath, "wb") as out:
        pdf_writer.write(out)

# 文档解密
decrypt_pdf(filepath, save_filepath, passwd='xiaoyi')
# 操作ppt:python-pptx
- 创建一个新的PPT文档
pip install python-pptx

from pptx import Presentation
prs = Presentation()
- 添加标题和副标题幻灯片
slide = prs.slides.add_slide(prs.slide_layouts[0])
title = slide.shapes.title
subtitle = slide.placeholders[1]
title.text = "Hello, World!"
subtitle.text = "python-pptx was here!"
- 添加一个带有子弹点的幻灯片
slide = prs.slides.add_slide(prs.slide_layouts[1])
title_shape = slide.shapes.title
body_shape = slide.placeholders[1]
title_shape.text = 'Adding a Bullet Slide'
tf = body_shape.text_frame
tf.text = 'Find the bullet slide layout'
p = tf.add_paragraph()
p.text = 'Use _TextFrame.text for first bullet'
p.level = 1
p = tf.add_paragraph()
p.text = 'Use _TextFrame.add_paragraph() for subsequent bullets'
p.level = 2
- 添加一个包含多个段落的文本框
slide = prs.slides.add_slide(prs.slide_layouts[6])
txBox = slide.shapes.add_textbox(Inches(1), Inches(1), Inches(5), Inches(1))
tf = txBox.text_frame
tf.text = "This is text inside a textbox"
p = tf.add_paragraph()
p.text = "This is a second paragraph that's bold"
p.font.bold = True
p = tf.add_paragraph()
p.text = "This is a third paragraph that's big"
p.font.size = Pt(40)
- 向幻灯片中添加图片
img_path = '1.png'
slide = prs.slides.add_slide(prs.slide_layouts[6])
slide.shapes.add_picture(img_path, Inches(1), Inches(1))
slide.shapes.add_picture(img_path, Inches(5), Inches(1), height=Inches(5.5))
- 添加自定义形状来表示流程或步骤
slide = prs.slides.add_slide(prs.slide_layouts[5])
shapes = slide.shapes
shapes.title.text = 'Adding an AutoShape'
left = Inches(0.93)
top = Inches(3.0)
width = Inches(1.75)
height = Inches(1.0)
shape = shapes.add_shape(MSO_SHAPE.PENTAGON, left, top, width, height)
shape.text = 'Step 1'
left += width - Inches(0.4)
width = Inches(2.0)
for n in range(2, 6):
    shape = shapes.add_shape(MSO_SHAPE.CHEVRON, left, top, width, height)
    shape.text = f'Step {n}'
    left += width - Inches(0.4)
- 添加一个表格
slide = prs.slides.add_slide(prs.slide_layouts[5])
shapes = slide.shapes
shapes.title.text = 'Adding a Table'
table = shapes.add_table(2, 2, Inches(2.0), Inches(2.0), Inches(6.0), Inches(0.8)).table
table.columns[0].width = Inches(2.0)
table.columns[1].width = Inches(4.0)
table.cell(0, 0).text = 'Foo'
table.cell(0, 1).text = 'Bar'
table.cell(1, 0).text = 'Baz'
table.cell(1, 1).text = 'Qux'
- 保存PPT文档
prs.save('test.pptx')
- 获取slide:.slides-> 得到一个列表,包含了每个slide
from pptx import Presentation

prs = Presentation('示例文件.pptx')
for slide in prs.slides:
    print(slide)
- 获取形状 shape
from pptx import Presentation

prs = Presentation('示例文件.pptx')
for slide in prs.slides:
    for shape in slide.shapes:
        print(shape)
- 输出shape中的文字
# 获取所有Slide中的内容
from pptx import Presentation

prs = Presentation('示例文件.pptx')
for slide in prs.slides:
    for shape in slide.shapes:
        if shape.has_text_frame:
            text_frame = shape.text_frame
            print(text_frame.text)

# 获取某一页Slide中的内容
from pptx import Presentation

prs = Presentation('示例文件.pptx')
for i, slide in enumerate(prs.slides):
    if i == 3:
        for shape in slide.shapes:
            if shape.has_text_frame:
                text_frame = shape.text_frame
                print(text_frame.text)
- 输出shape中的某个paragraph
from pptx import Presentation

prs = Presentation('示例文件.pptx')
for slide in prs.slides:
    for shape in slide.shapes:
        if shape.has_text_frame:
            text_frame = shape.text_frame
            for paragragh in text_frame.paragraphs:
                print(paragragh.text)

"""
注意:
该方法同样也直接获取Shpae中的文字内容;
但是这个更灵活,先获取每个Shape,然后在获取每个Shape中的paragraph;
我们可以针对paragraph,写一个判断条件,只获取第几个paragraph;
""
- 文本框位置调整
from pptx import Presentation
from pptx.util import Cm
from pptx.enum.text import MSO_ANCHOR, MSO_AUTO_SIZE

prs = Presentation()
blank_slide_layout = prs.slide_layouts[6]
slide = prs.slides.add_slide(blank_slide_layout)

left = top = width = height =Cm(3)
text_box = slide.shapes.add_textbox(left,top,width,height)
tf = text_box.text_frame
tf.text = "这是一段文本框里的文字"

tf.margin_bottom = Cm(0.1) #下边距
tf.margin_left = 0 #左边距
tf.vertical_anchor = MSO_ANCHOR.BOTTOM # 对齐文本方式:底端对齐
tf.word_wrap = True # 框中的文字自动换行
prs.save('文本框样式的调整.pptx')
- 文本框背景颜色调整
from pptx import Presentation
from pptx.util import Cm, Pt
from pptx.enum.text import MSO_ANCHOR, MSO_AUTO_SIZE
from pptx.dml.color import RGBColor

prs = Presentation()
# 使用第七个版式
black_slide_layout = prs.slide_layouts[6]
slide = prs.slides.add_slide(black_slide_layout)

left = top = width = height = Cm(3)
text_box = slide.shapes.add_textbox(left, top, width, height)
tf = text_box.text_frame
tf.text = "这是一段文本框里面的文字"
# -------------------------------------- #
tf.margin_bottom = Cm(0.1) # 下边距
tf.margin_left = 0 # 下边距
tf.vertical_anchor = MSO_ANCHOR.BOTTOM
tf.word_wrap = True # 框中的文字自动换行
# -------------------------------------- #
fill = text_box.fill
fill.solid()
# 使用之前一定要导入RGBColor这个库
fill.fore_color.rgb = RGBColor(100, 149, 237)

prs.save("文本框背景色的调整.pptx")
- 文本框边框样式调整
from pptx import Presentation
from pptx.util import Cm, Pt
from pptx.enum.text import MSO_ANCHOR, MSO_AUTO_SIZE
from pptx.dml.color import RGBColor

prs = Presentation()
# 使用第七个版式
black_slide_layout = prs.slide_layouts[6]
slide = prs.slides.add_slide(black_slide_layout)

left = top = width = height = Cm(3)
text_box = slide.shapes.add_textbox(left, top, width, height)
tf = text_box.text_frame
tf.text = "这是一段文本框里面的文字"
# -------------------------------------- #
tf.margin_bottom = Cm(0.1) # 下边距
tf.margin_left = 0 # 下边距
tf.vertical_anchor = MSO_ANCHOR.BOTTOM
tf.word_wrap = True # 框中的文字自动换行
# -------------------------------------- #
fill = text_box.fill
fill.solid()
# 使用之前一定要导入RGBColor这个库
fill.fore_color.rgb = RGBColor(247, 150, 70)
# -------------------------------------- #
line = text_box.line
line.color.rgb = RGBColor(255, 0, 0)
line.width = Cm(0.3)

prs.save("文本框边框样式调整.pptx")
- 段落对齐调整
from pptx import Presentation
from pptx.enum.text import PP_ALIGN
from pptx.util import Cm

prs = Presentation()
# 使用第七个版式
black_slide_layout = prs.slide_layouts[6]
slide = prs.slides.add_slide(black_slide_layout)

left = top = width = height = Cm(3)
text_box = slide.shapes.add_textbox(left, top, width, height)
tf = text_box.text_frame
# ---------------------------- #
p = tf.add_paragraph()
p.text = "这是第二段文字"
p.alignment = PP_ALIGN.LEFT  # 左对齐

prs.save("段落对其调整.pptx")

# 段落其他样式调整
# .add_run() 添加新的文字块
# .level 段落缩进层级
# .line_spacing 段落行间距
# .runs 段落内的文字块
# .space_after 段后距
# .space_before 段前距
- 字体样式调整
from pptx import Presentation
from pptx.util import Cm, Pt
from pptx.enum.text import MSO_ANCHOR, MSO_AUTO_SIZE
from pptx.dml.color import RGBColor
from pptx.enum.text import PP_ALIGN

prs = Presentation()
# 使用第七个版式
black_slide_layout = prs.slide_layouts[6]
slide = prs.slides.add_slide(black_slide_layout)

left = top = width = height = Cm(3)
text_box = slide.shapes.add_textbox(left, top, width, height)
tf = text_box.text_frame
# ---------------------------- #
p = tf.add_paragraph()
p.text = "这是第二段文字"
p.alignment = PP_ALIGN.LEFT
# ------------------------------------- #
p.font.bold = True
p.font.name = "宋体"
p.font.color.rgb = RGBColor(247, 150, 70)
p.font.size = Pt(30)

prs.save("字体样式调整.pptx")

# .font.name 字体名称(可以直接设定为中文字体)
# .font.bold 是否加粗
# .font.italic 是否斜体
# .font.color 字体颜色
# .font.size 字体大小
# 数据库的使用
# MySQL 数据库
在Python中,使用第三方库 pymysql 来完成对 MySQL 数据库的操作
pip install pymysql
创建到MySOL的数据库链接
from pymysql import Connection

# 获取到MySQL数据库的链接对象
conn = Connection(
	host = 'localhost',
	port = 3306,
	user = 'root',
	password = '123456',
	db='cloud-user',
)

# 打印MySQL数据库软件信息
print(conn.get_server_info())

# 关闭到数据库的链接
conn.close()
- 执行SQL语句
from pymysql import Connection

# 获取到MySQL数据库的链接对象
conn = Connection(
	host = 'localhost',
	port = 3306,
	user = 'root',
	password = '123456',
	db='cloud-user',
)

# 执行DML语句
cursor = conn.cursor()
conn.select_db("cloud-user")
cursor.execute("CREATE TABLE student(id INT, name VARCHAR(255))")

cursor.execute("insert into student values(10001,'sylone')")
conn.commit() # 上面的语句需要 commit() 方法
# 如果不想手动 commit 确认,可以在构建链接对象的时候,设置自动commit的属性
# autocommit=True

# 执行DQL语句
cursor = conn.cursor()
sql = 'select * from tb_user'
cursor.execute(sql)

result = cursor.fetchall()
for i in result:
    print(i)

# 关闭到数据库的链接
conn.close()